
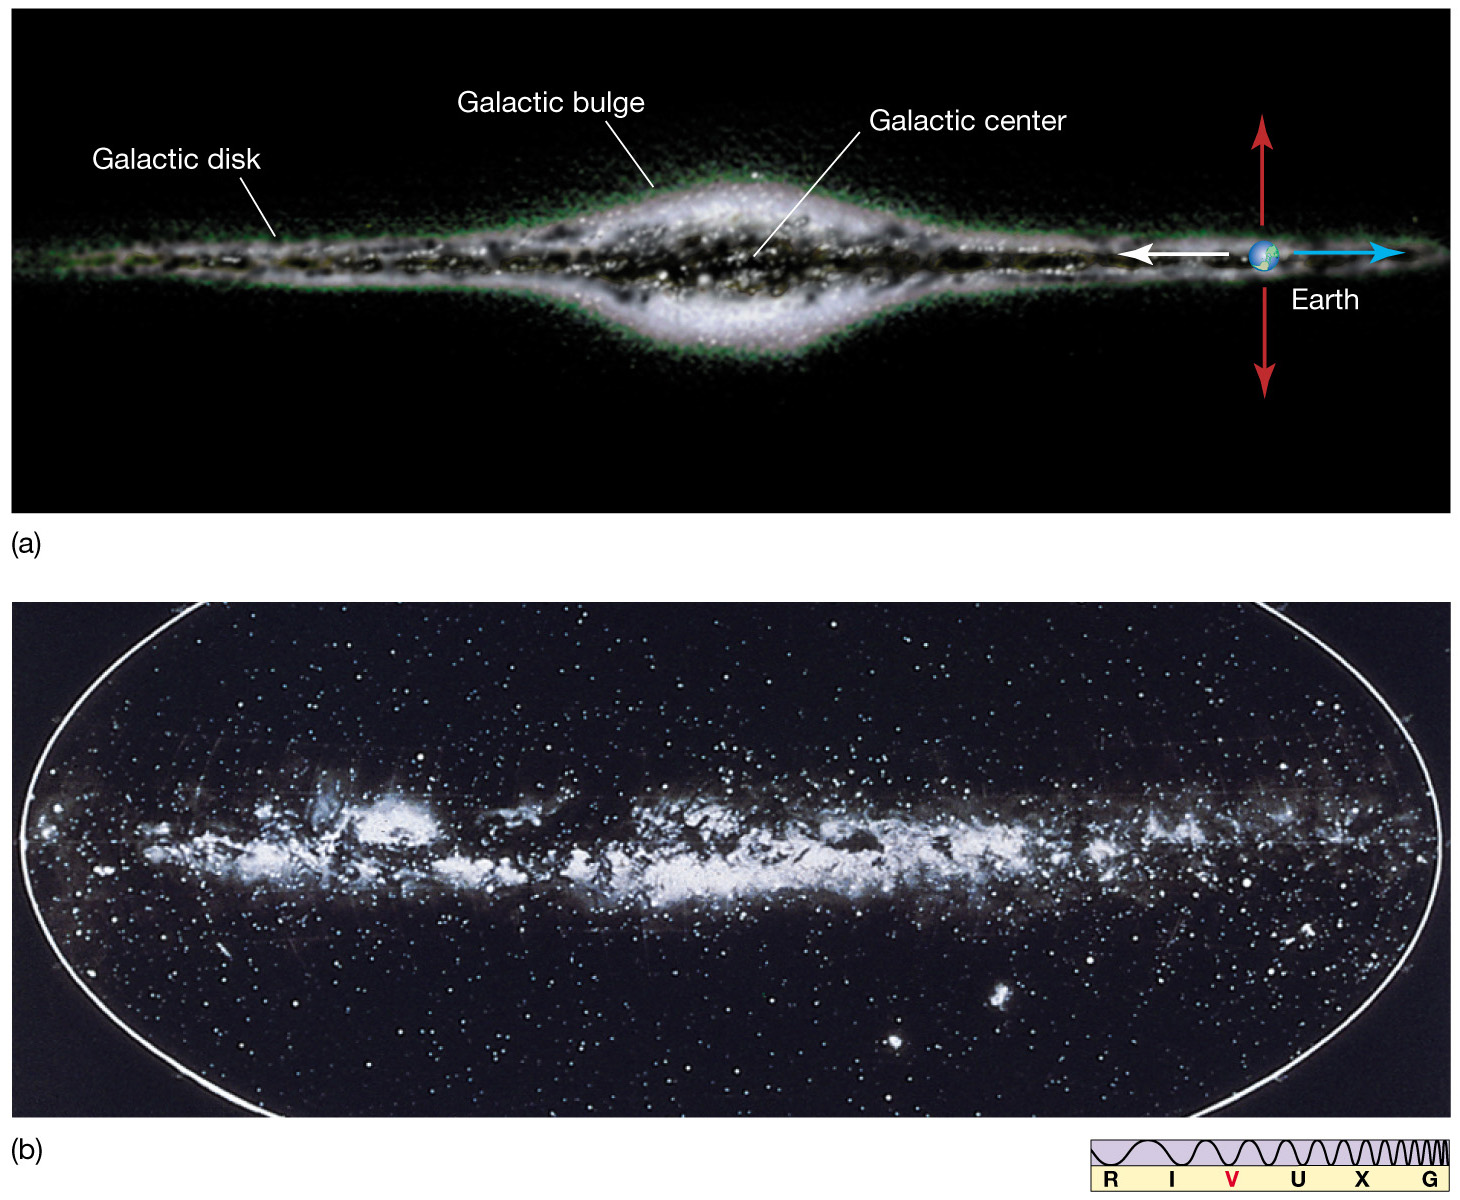
MVNSC: Stars in our Milky Way Galaxy
To the naked eye, everything we see in the night sky is in our galaxy
… the vast expanse of interstellar space, galaxies, suns and planets in their courses…

courtesy Sanjeev Sivalrurasa
WHERE
- Locating stars on the Celestial Sphere
- Star Maps and Constellations, Planisphere or Monthly Sky Map
WHEN
- Do they rise and set on our local horizon
- Star time (When do the same stars appear to rise night after night)
For Where and When, visit Night Sky Course – https://millstonenews.com/2014/03/night-sky-course-understanding-the-location-of-stars.html
WHAT is a Star
-
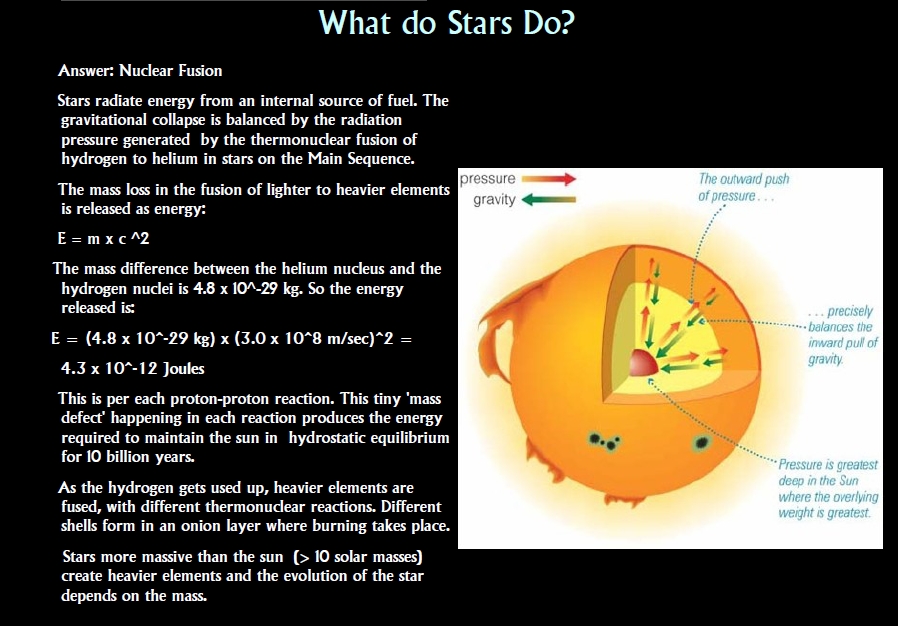
- A large body of gas that at some time in its life generates light and heat by nuclear fusion – specifically by fusion of hydrogen into helium at enormous temperatures and pressures.
- When hydrogen atoms merge to form helium, mass (M) converted to energy (E) through Einstein’s famous equation E = mc squared, where “c” is the speed of light.
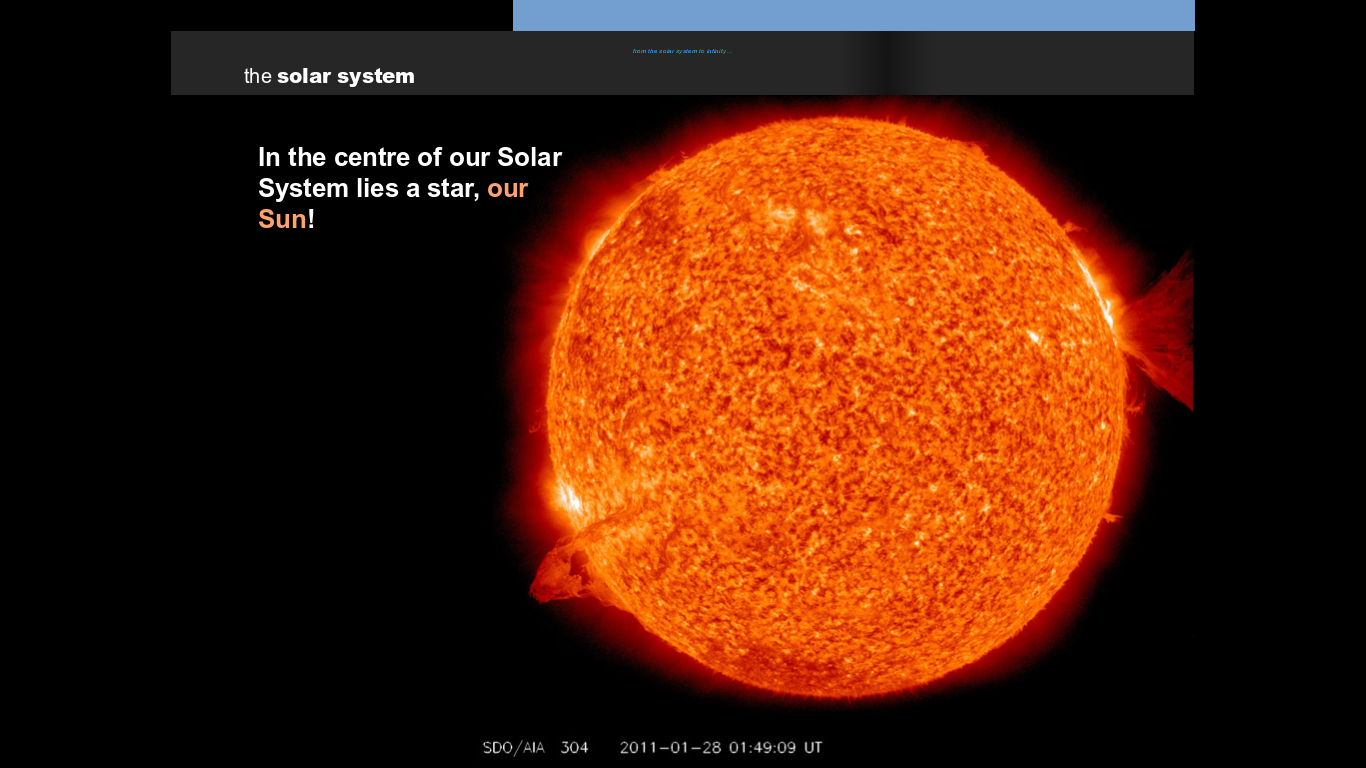
- The Sun is powered by hydrogen fusion, as are many of the other stars you see at Night
- For all Stars in the Universe the matter is primarily 75% Hydrogen. These are normal, ‘Main Sequence’ stars – busily burning hydrogen and fusing it to helium.
- Other heavier elements are created either as a result of the continued fusion of elements heavier than helium within a star or during a supernova explosion
- Stellar properties –
- Temperature (based on recorded color),
- Mass,
- Luminousity,
- Magnitude,
- Movement: Radial Velocity (towards or away from us) Proper Motion (only very close stars exhibit movement)
Starlight – The Signature of Stars “hidden in light”
“No laboratory jar on Earth holds a sample labelled ‘star stuff’ and no instrument has probed inside a star. The stars are beyond our reach, and only information we can obtain about them comes to us hidden in light” – Michael A. Seeds , Horizons – Exploring the Universe
Star Colours Indicate Star Temperature
Stars show different colours because their of their temperature; some are hotter than others. Deep in their interior all stars are enormously hot (millions of degrees), but their temperature lessens towards their outer layers, and the coolest star pours out most of their visible radiation in the red part of the spectrum. Hotter stars like the Sun appear yellow, still hotter stars appear white, and the hottest appear blue. Stars radiate light a little like glowing coals in a campfire. Just as a glowing red-hot coal is cooler than a white-hot coal, for example, so a red star is cooler than a white star, and a white star is cooler than a blue star.
Star Color and Temperatures

Heat is kinetic energy at the level of atoms. The vibrating atoms collide with the electrons in the material, and each time the motion of the electrons gets disturbed in at a particular quantum level, a photon is emitted. Heated objects emit electromagnetic radiation. When objects are heated to extreme temperatures, they glow at a peak wavelength, λMax.

Stars have color variations which we can perceive even without optical aids, and this is related to the characteristic wavelength recorded in the stars.
From the graph, we can see that the hotter the object, the shorter the peak wavelength. We know the relationship as Wien’s Law:
The longer wavelength peaks (Red ligth) at the lower temperature ~ 5000K. The shorter wavelength peaks, for high energy (Blue light) indicates a higert temperature.
Peak radiation for Shorter(bluer) Wavelength = high temperature ~ Blue Stars
Peak radiation for Longer (redder) Wavelength = low temperature ~ Red Stars
λMax = 3,000,000/T
This physical law gives us the key to estimate a star’s temperature from the starlight. Knowing the temperature (thousands of degrees), we can apply our models of the energetic nature of stars and their physical processes to graph them and classify them.
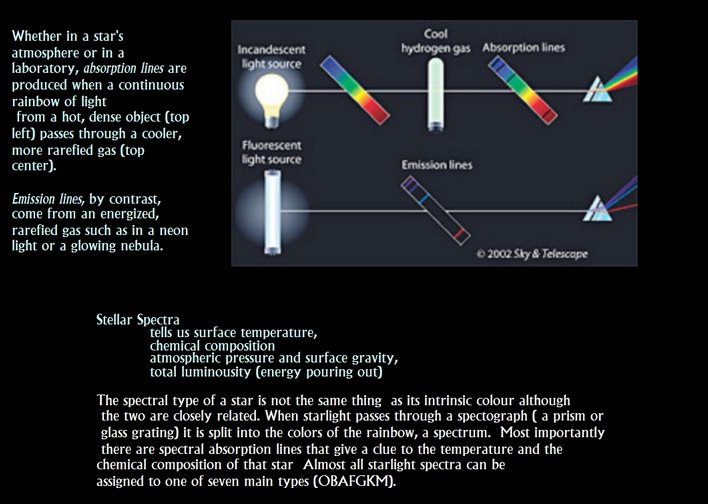
Star Color and Spectra

Starlight Analysis in terms of Spectra
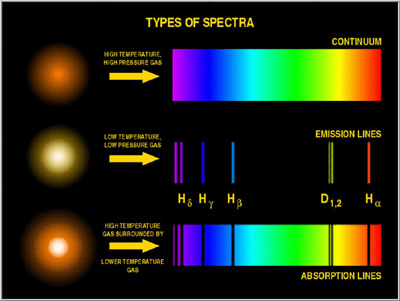
When we record starlight passing through a slit and prism or a diffraction grating (a spectroscope) unto special cameras, we split the components of light into a rainbow of colors interspersed with spectral lines. The position of the lines is compared to a standard ‘plate’.
Each dark line that appears in a certain colour band (frequency) represents the detection of the gaseous state of a chemical element. when plotted as a light curve the dark lines reveal reduced intensity (dips) how much hydrogen or helium gas is absorbing light radiation.


Each line indicates ion of a certain chemical element with the line strength indicating the abundance of components such as hydrogen and helium in a gaseous ionic form (with electrons removed from the atom).
Any shifts of the line reveal tiny changes in wavelength that could mean :
- chemical composition in the stellar atmosphere and hotter or cooler gas…
- relative velocity of the star with respect to earth …
- Spectroscopic binaries appear close even when viewed through a telescope. Scientists must measure the wavelengths of the light the stars emit and determine their binary nature based on features of those measurements.

Spectral Classification of stars according to what kind of stellar spectra is measured when we analyze the starlight. The classification is broken into 7 classes. O .. B .. A .. F .. G.. K.. M ( nmemonically remembered as:Oh, Be A Fine Girl Kiss Me)

Each line indicates an ion of a certain chemical element. The line strength indicating the abundance of that ion.
These are the beginnings of the spectral classifications – B A F G K M (left side) and the chemical signatures in the lines are shown above and below, Hydrogen ions , Potassium, etc.
- How much energy the star is generating depends on its mass and current state of fusion reaction. If stars fall on the Main Sequence curve their Mass is proportional to some power (roughly 4) of the Luminousity.
L ~ M^4 where M is a unit of Solar Mass.
- Giant stars form their own clump on the upper-right side of the diagram. Above them lie the much rarer bright giants and supergiants.
- High mass stars are already large and luminous. As their dead helium cores contract, heating and firing to fuse the helium to carbon and oxygen, the stars expand to approach the sizes of the orbits of the outer planets, becoming distended red “supergiants.” Excellent examples are Aldeberan in Taurus (yellow-orange type K giant) and Betelgeuse in Orion. These have a reddish colour to the eye.
- At the lower-left is the band of white dwarfs – these are the dead cores of old stars which have no internal energy source and over billions of years slowly cool down towards the bottom-right of the diagram
- The ordinary hydrogen-burning dwarf stars like the Sun are found in a band running from top-left to bottom-right called the Main Sequence. For the Main Sequence, everything about the stars is determined by the mass .
-
- High Luminousity stars are the Hot Blue young stars with lots of mass.
- Low luminousity stars on the Main Sequence are fainter and less massive.
-
Visual Observations can reveal Stellar Properties
Many observers ask questions about the brighter stars they see night after night. The nature of starlight helps us to understand how astronomers classify stars.
-
-
- Colour: Observe that stars have colour: Vega, we observed was bluish-white.This determines a spectral temperature classification.
- Brightness: Observe both Vega and Regulus are bright stars meaning they have a certain visual magnitude classification.
- Variable radiation:Certain stars vary in brightness over the course of a night(short period variables)
-
Special variable stars called Cepheid variables help us determine distance measurements using only Starlight:
- Show a periodic variation where the period tells us the intrinsic luminousity
- Distance measurement to these stars given by calibrated known distances to nearby variables and knowing intrinsic luminousity.
- A dimmer Cepheid variable will have a distance we can calculate based on the standard ‘candle’
To find out why Cepheid Variables pulsate see:
Binary or Exoplanet Stellar Systems: Detected by spacecraft and special instruments like spectroscopes
A binary star is a star system consisting of two stars orbiting around their common center of mass. Systems of two, three, four, or even more stars are called multiple star systems. These systems, especially when more distant, often appear to the unaided eye as a single point of light, and are then revealed as double (or more) by astronomical photometry and the radial velocity method . By measuring subtle variations in the brightness of the light curve, astronomers can infer whether there are orbiting bodies around the star. If the graph shows a dip in energy output.
The Kepler Spacecraft uses transit photometry to measure the dips in brightness – See Kepler Detects exoplanets using transit photometry
- Kepler’s 3rd Law of orbital motion: P^2 ~ a^3
where P is the orbital period (in years), a the semi-major axis of the orbit (in astronomical units)
- M and m the masses of the two objects (in solar masses). If we could identify binary stars that orbit around each other, and if we could measure their Period P and their semi-major axis, a , we could measure their (combined) mass. Knowing the relative distance from the center of Mass of the two stars orbiting around each other: M1/M2 = r2/r1
Spectroscopic Binaries – using the radial velocity method: See https://en.wikipedia.org/wiki/Doppler_spectroscopy
Measuring the time period between ‘wobbles’ we get the Period of orbit and apply Kepler’s law of Planetary motion:
![]()
![]() From the velocity of the planet we can apply conservation of angular momentum to determine the mass of the planet:
From the velocity of the planet we can apply conservation of angular momentum to determine the mass of the planet:
![]()
where  is the velocity of parent star. The observed Doppler velocity,
  , where i is the inclination of the planet’s orbit to the line perpendicular to the line-of-sight. Thus, assuming a value for the inclination of the planet’s orbit and for the mass of the star, the observed changes in the radial velocity of the star can be used to calculate the mass of the extrasolar planet.
Magnitudes of Stars – How Bright is your Star: first to sixth magnitude
The Greeks divided the stars into 6 brightness categories. The brightest stars were called category one or first magnitude. The dimmest stars were category 6 or sixth magnitude. The lower,the number the brighter the star. This system of magnitude brightness categories is still used today for visual observing.
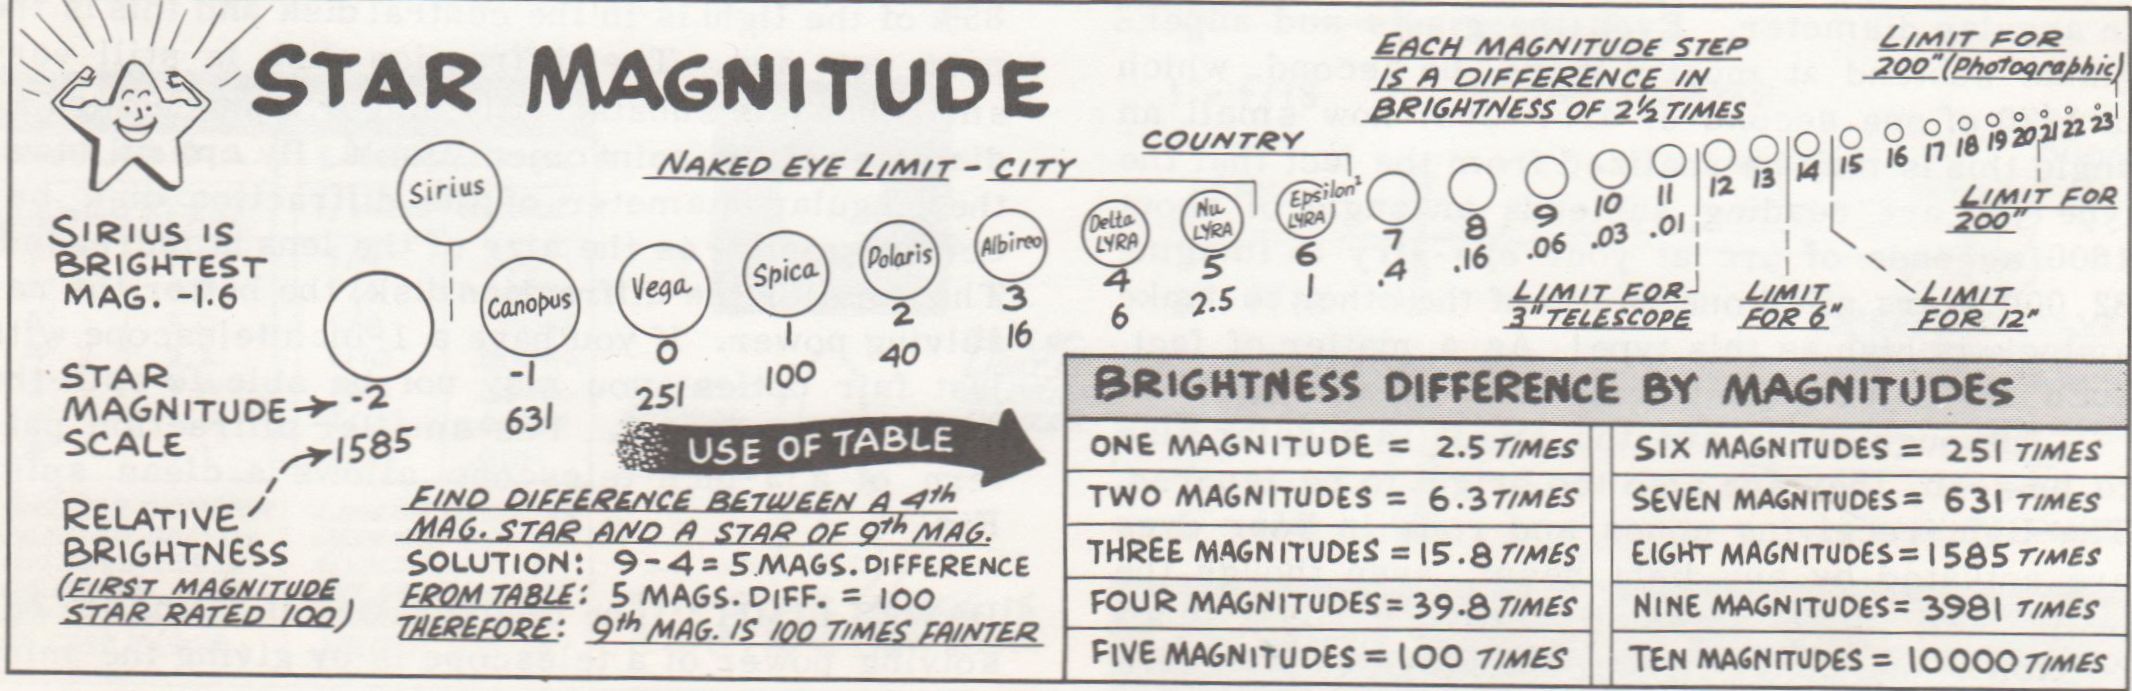
System Conventions
Magnitude 1 is 2.5 times brighter than magnitude 2 because a first magnitude star is 100 times brighter than a 6th magnitude star that is we multiply by :
![]() (Each change of 1 magnitude represents the (5th root of )√ 100.)
(Each change of 1 magnitude represents the (5th root of )√ 100.)

Naked Eye limit at the Mill of Kintail is roughly mag 5

Brightness vs. Distance of an object
Why stars are brighter or fainter. A star might be brighter than another star because:
- It is extremely energetic and its stellar properties produce intense visible radiation. In this case the objects intrinsic brightness or luminousity dominates. We will learn that how bright a star ‘burns’ depends critically on its mass. … OR…
- It is at a closer distance to our solar system
Some properties of stars in the Spring Sky:
| Star | Visual Magnitude | Distance (Light Years) | Temperature | Notes |
| Arcturus | -0.4 | 37 | 4290(degrees K) | Arcturus is located at a distance of 37 light years, and became famous when its light was used to open the 1933 world’s fair in Chicago, as that light had left the star at about the time of the previous Chicago fair in 1893. It is a classic orange class K (type K1)) giant star with a precisely defined surface temperature of 4290 degrees Kelvin. |
| Regulus | 1.3 | 78 | 1300 | Regulus is the brightest star in constellation LeoL Blue-white main sequence star – roughly 3.5 solar masses . It is close to the plane of the ecliptic, and so gets occulted by planets. Has a companion star, which itself is a double star |
| Polaris | 1.98 | 782 | 7000 | Closest star to the pole. It is a Cepheid, Variable Star, a yellowish supergiant – type 1b |
WHO
- Pioneers in stellar astronomy:
-
- Joseph von Fraunhofer – Spectra of the Sun
- Annie Jump Canon – Spectra of the Stars
- Ejnar Hertzprung- Henry Russell – Graph of the Stars based on the Spectra
Spectra of the Sun: Joseph von Fraunhofer
Joseph von Fraunhofer studied the solar spectrum using a setup he invented: a prism, a narrow slit and a telescope, to focus and sharpen the image. He found and classified around 600 dark lines. At that time, he did not know that the lines numerically corresponded to a particular wavelength of light, nor that the dark lines were actually showing absent light radiation which had been absorbed by solar chemical components Scientists realized that the lines were related to the various atoms in the sun.

A link describing Fraunhofer’s discovery : http://www.suntrek.org/hot-solar-atmosphere/solar-fingerprints/fraunhofer-spectrum.shtml which explains:
“What are the Fraunhofer lines and how are they formed?
When the visible light from below the Sun’s surface passes through the layers above it (the photosphere and chromosphere), some of the light at particular wavelengths is absorbed by atoms and ions and so is missing in the spectrum we see. When there is no light it appears as black in the spectrum.”
Stellar Classification: Annie Jump Canon – Spectra of the Stars
Annie Jump Cannon derived a division of stars into the spectral classes O, B, A, F, G, K, M, and so on. . Her “eye” for stellar spectra was phenomenal, and her Draper catalogs (which ultimately listed nearly 400,000 stars) were valued as the work of a single observer. Cannon also published catalogs of variable stars (including 300 she discovered). Annie worked from photographic plates that recorded the light passing through the spectograph. The stellar classification grouping all stars into just 7 categories was born: OBAFGKM designations are applied to every star.
courtesy: http://www.sdsc.edu/ScienceWomen/cannon.html
Spectral Lines… The fingerprints of stars
Stars we know and what we know:

Thanks to Annie’s Stellar Classification (the 7 major divisions), we can graph their properties:
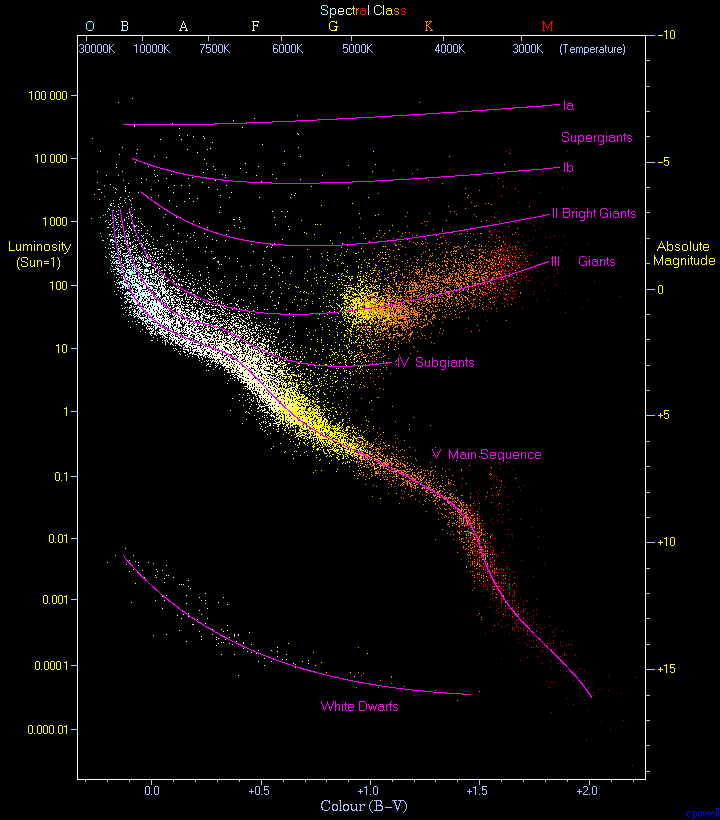
A Stars Luminousity (RightBar) plotted against its Spectral Class (and hence temperature)
Larger stars are luminous but not as hot . At a given temperature, large stars like Beteulgeuse (M-type) will be more luminous but will have a low temperature. At a given luminousity, hot stars are more energetic, less (swollen) and hence more smaller.
Typically, Graphs which show stellar properties do so with:
- Temperature decreases to the right.
- Luminousity increases bottom to top
- Spectral Types correspond to Temperature Ranges
The Hertzsprung-Russell Diagram – Graph of the Stars

Around 1911-1913, the Danish astronomer Ejnar Hertzsprung and American Henry Norris Russell studied star clusters, in which all the stars are roughly the same age, and noticed a clear and surprising relationship between the stars’ brightness and color. They plotted the color and temperature (as represented by OBAFGKM) classification of each star and determined blue stars are brighter and red stars are fainter along the central Main Sequence curve.
Stars are not static eternal creatures, but in a certain sense are living bodies: we speak of stars being born, of evolving and of dying…
courtesy Stars and their Spectra, J. Kaler [p. 29]
- The large majority of stars fall within the Main Sequence which represents normal hydrogen-burning stars arrayed according to their masses.
- As the mass of the star goes up, so does the size of its core, so that more fuel is available for burning.
- More importantly, the interior temperature goes up as well.
- The rate of thermonuclear reaction depends on the mass of the star and hence the luminousity depends on the mass of the star
- The more massive stars burn their fuel much more rapidly, and hence burn out more quickly
- When the nuclear fuel is used up, the core loses a major part of its support, and contracts under gravity: the star then has to heat up which initiates further fusion… more on this later…
For Main Sequence normal mass stars, once a star begins burning hydrogen through nuclear fusion, it settles onto a particular spot on the main sequence and stays there until the hydrogen runs out. For historical reasons, stars along the main sequence are called “dwarfs” and are given the additional symbol “V”. So the Sun is a G2-type dwarf star, or G2V. As a star begins to burn helium and heavier elements in the core, it quickly evolves off the main sequence into other types of stars like giants, supergiants, and eventually white dwarfs.
Notes: The Main Sequence represents ‘normal’ stars that are relatively stable nuclear furnaces. The Super Giants, Giants and White Dwarfs are classifications of stars that are in the process of evolving due to the changes arising fuel exhaustion.
 To understand how different stellar masses take different paths along the HR diagram see: https://millstonenews.com/2014/05/night-sky-course-lab-fun-with-stellar-evolution.html