
MVNSC: Mississippi Valley Night Sky Conservation: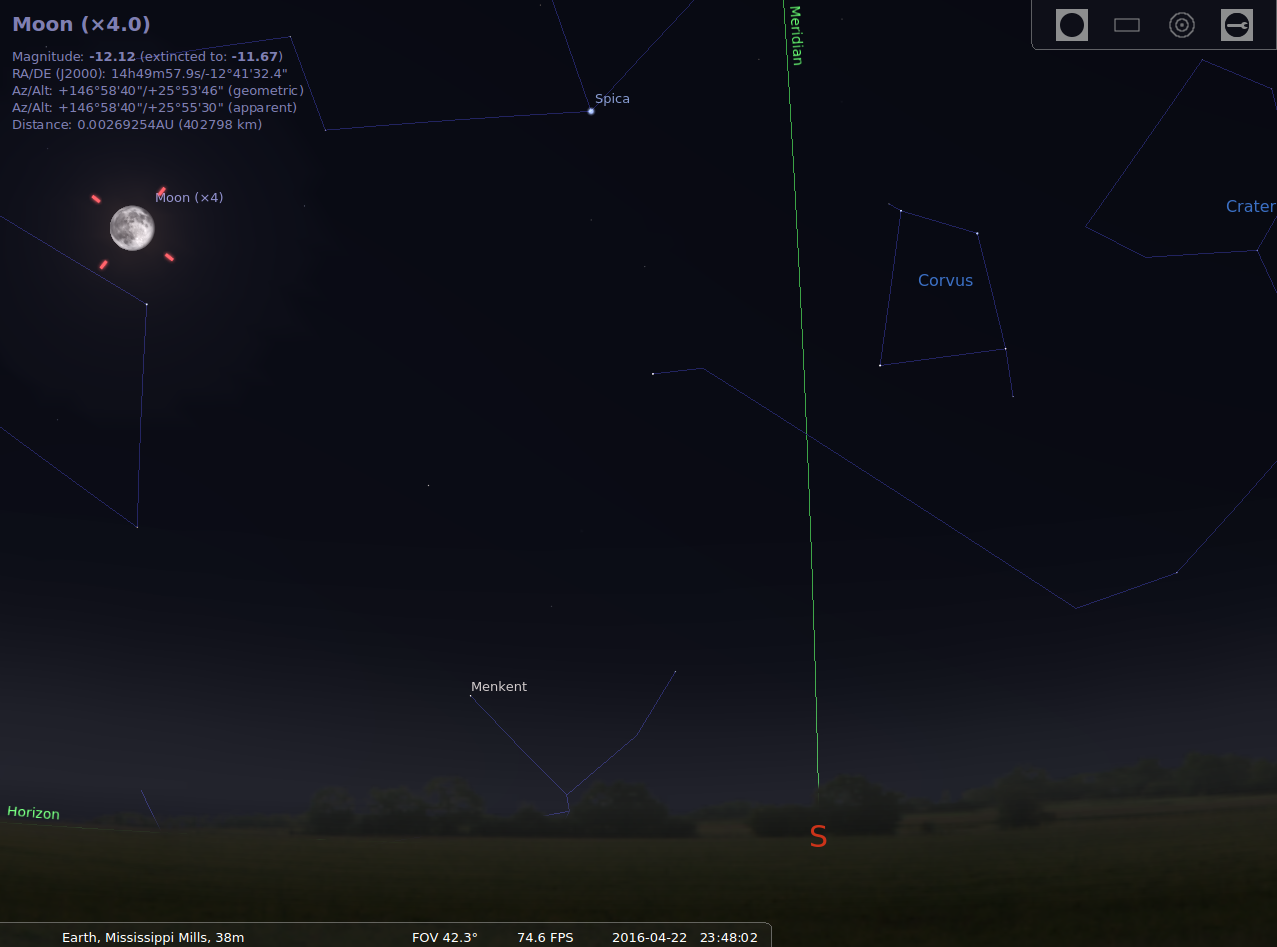
The Night Sky Around Us Lecture 4
Program developed by:
- Mississippi Valley Conservation Authority
- Royal Astronomical Society of Canada
- Ottawa Astronomy Friends
- Instructor: Pat Browne
- Assistants: Shawn McKay
- Note: Donations can be receipted as charitable . Donations can be made online at canadaHelps – (choose Night Sky Conservation fund):
Night Sky Conservation Fund
Clarification on Earth-Moon System from last week
Question: What do we know about the early earth-moon system in terms of:
- earth-moon distance
Scientists can determine the distance Earth-Moon with great precision. They achieve this by bouncing a laser beam on special mirrors deposited on the Moon ́s surface by astronauts in 1969, and measuring the round travel time of the light
With these observations, they have directly measured that the Moon is slowly receding from the Earth. That is, the Earth-Moon distance is increasing with time. This is happening because tidal torques on the Earth are transferring angular momentum to the Moon


- Earth-moon rotational dynamics
- Evolution of the System – “The Big Thwack”
- Was the moon tidally locked initially?… what are the implications
Earth-Moon Rotational Dynamics – Tidal Locking of Earth Moon System:
Tidal locking: Lunar orbital Period = Period of Lunar revolution about lunar axis:
- Left: (Except for libration effects), Moon keeps the same face turned toward Earth
- If the Moon were not rotating at all, it would alternately show its near and far sides to Earth, while moving around Earth in orbit (picture at right).
– courtesy “Wikipedia Tidal Locking”
Conservation of Angular Momentum
The gravitational torque between the Moon and the tidal bulge of Earth causes
the Moon to be constantly promoted to a slightly higher orbit and Earth to be
decelerated in its rotation.
Total energy and angular momentum are conserved.
- Energy and angular momentum are transferred from the rotation of Earth to the orbital motion of the Moon
- However, most of the energy lost by Earth is converted to heat by frictional losses in the oceans and their interaction with the solid Earth, and only about 1/30th is transferred to the Moon).
- The Moon moves farther away from Earth (+3.8 cm/y) in order to maintain conservation of angular momentnum
– courtesy Wiki article on Tidal Acceleration
Reason for Increasing Lunar Orbit
Earth’s tidal bulges make opposite torques on the moon, and these torques don’t exactly cancel. The lack of cancellation is because friction causes the bulges to be misaligned with the earth-moon axis, and also because the bulges are at unequal distances from the moon, as explained by the following diagram:
As the moon moves in its orbit, the bulge of the tides leads a little bit (because of drag on the earth’s surface). Consequently, the bulge that is closer (and thus has a stronger force on the moon) is slowing the moon down a little bit; this force is not completely canceled out by the “leading” bulge on the other side, which is further away and therefore provides a weaker force.
This results in the dotted line (net force) drawn, which speeds the moon in its orbit. This actually causes it to move to a larger radius . But there is no torque on the moon about its own axis of rotation based on these tides on earth.
– courtesy ” courtesy physics stack exchange: conservation of Angular Momentum>
The Big Thwack – Early Earth-Moon System Formation
In Earth history, one single event .. one day more memorable than any other. About 4.5 billion years ago, when the Solar System was about 50 million years old, the black proto-Earth and a slightly smaller planet-size competitor were jockeying for the same narrow band of Solar System real estate. The smaller would-be planet (dubbed Theia, after the Titan goddess who gave birth to the Moon) was worthy of planetary status perhaps two to three times the size of Mars (or roughly a third of Earth’s mass). A rule of astrophysics is that no two planets can share the same orbit. Eventually they will collide, and the larger planet always wins. So it was with Earth and Theia.
Computer simulations provide the principal method by which scientists attempt to understand what might have happened. A big collision is governed by the laws of physics, so one can run thousands of simulations with all sorts of initial conditions to see if a Moon results. The answer is intimately tied to the starting parameters: the mass and composition of the proto-Earth, the mass and composition of Theia, their relative velocities, and the angle and accuracy of the blow.
Theia was roughly 40 percent the mass of the proto-Earth. Again, an off-center impact occurred, but in this version, Theia more or less bumped against Earth and bounced off as an elongated blob, then was pulled back in for the coup de grace .. a second thwack, in which Theia disappeared forever. In either case, the catastrophe annihilated Theia, which simply vaporized into an immense incandescent cloud, tens of thousands of degrees hot, surrounding Earth. Not all of Theia was captured, however. Higher up in space, Earth became encircled by a vast accumulation of rocky collisional debris, mostly an intimate mixture of the two planetary mantles. Cooling rocky droplets stuck together, with bigger chunks sweeping up the smaller. In a sort of instant replay of the gravitational clumping that originally formed the planets, the Moon coalesced rapidly and may have achieved more or less its present size in a few years.
The physics of planet formation dictate where the Moon could have formed. Every massive object has an invisible surrounding sphere, called the Roche limit, inside of which gravitational forces are too great for a satellite to form. That’s why Saturn has immense rings but no moons within about fifty thousand miles of its surface.Calculated from the center of a rotating object, Earth’s Roche limit is about 11,000 miles, or roughly 7,000 miles up from the surface. See wiki article – Roche limit
Accordingly, models of Moon formation locate the new satellite at a safe distance of about 15,000 miles up, where it could grow in an orderly fashion by sweeping up most of the scattered bits and pieces from the Big Thwack. And so, perhaps 4.5 billion years ago by most estimates, the Moon was born. Earth found itself with a companion, formed in large part from pieces of itself.
Original Distance, Lunar Orbit and Earth Spin
4.5 billion years ago, things were very different. With the Moon only 15,000 miles away, everything was turning ridiculously fast, like the ice-skater who pulls in [his] arms to speed up [his] spin.
For one thing, Earth rotated on its axis once every five hours. It still took a full year (about 8,766 hours) to go around the Sun; that time hasnt changed much in the history of the Solar System But ancient fossil corals from the Devonian Period, about four hundred million years ago, display more than four hundred daily lines per year, pointing to a faster rotation rate. Days were only about twenty-two hours long back then, when the Moon was perhaps ten thousand miles closer to Earth.
The total amount of spinning energy of the Earth-Moon system – its angular momentum is measured by a combination of two familiar circular motions. First is Earths rotation about its axis; the faster Earth rotates, the more angular momentum it has. The Moons angular momentum, by contrast, depends primarily on how far away and how fast it orbits around Earth. Its own rotation is not a significant part of the equation.
The total angular momentum of Earth’s rotation plus the Moon’s orbit hasn’t changed significantly over the last several billion years, but the relative importance of those two motions has changed a lot. Today almost all the angular momentum of the Earth-Moon system is tied up in the orbiting Moon, with its 239,000-mile distance and twenty-nine-day orbital period. These epic tidal disruptions lie at the heart of why the Moon keeps moving away from Earth. How does a 2,160-mile-wide object drift from a mere 15,000 miles to 239,000 miles away? The answer is found in the conservation of angular momentum the constant sum of Earths rotational energy plus the Moons orbital energy. The laws of physics dictate that whatever angular momentum the Earth-Moon system had at its origin, it must still possess in large measure today
.
Summary
- Tidal Locking of the satellite – Moon into the Earth Moon System – after the Big Thwack
- Earth-Moon distance The Moons orbit is increasing: – the moon’s orbit is increasing in size as it moves away from the earth at a rate of 4 cm/year or 4km/10,000 years. However at the time of formation of the earth-moon system, the moon was only 3 to 5x the Earth radius in distance – sufficiently far enough to be outside of the Roche Limit.
The Moon’s gravity produces tidal deformations or bulges in the Earth. - Dynamics of change – The Earth’s spin speed is decreasing so its spin angular momentum is DEcreasing. Therefore, the Moon’s orbital angular momentum must compensate by INcreasing. It does this by increasing the Earth-Moon distance.
- Cause: Because of the Earths rotation, the line that goes through the bulges is not aligned with the line between the Earth and the Moon. This misalignment produces a torque that transfers angular momentum from the Earth’s rotation to the Moon’sorbital translation. There is a consistent Torque on the satellite pushing it into a higher orbit
- Effect: Corresponding slowdown of the primary’s rotation See Description of the Earth Moon case – Tidal Acceleration Wikipedia
- Implications – final transfer of momentum – locking of Primary (Earth)
Implications
This process of transfer of angular momentum will end when the period of rotation of the Earth and the period of revolution of the Moon around the Earth have the same duration. At this point the tidal bulges produced by the Moon on the Earth will be aligned with the line between the Moon and the Earth and the torque will disappear.
The present distance between the earth and the moon is 384,000km.
The final distance at which the Earth will also be locked such that the day on earth (the period of revolution) will be the same as the period of rotation of the earth is calculated to be about 540,000 kms (1.4x).
At this time, a day on earth will amount to 46 current days.
-courtesy “Evolution of the Earth-Moon System – Calculations”
Pre-Dawn Observations before Sunrise – 2 Planets Saturn, Mars and some star…
We had a report this week of an early morning bright star and planets trio:
-courtesy stellarium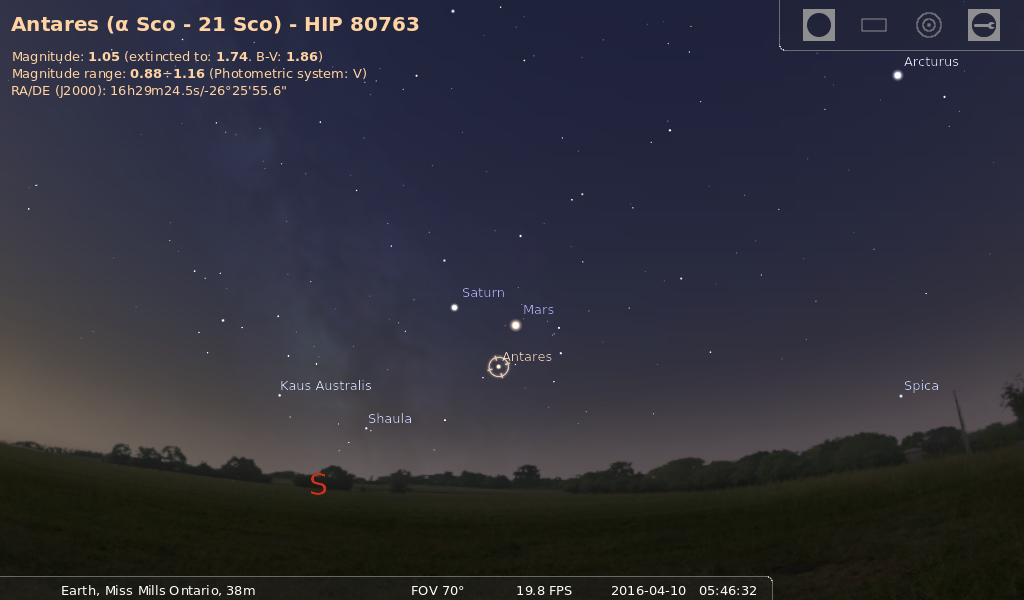
-That bright star – it’s Antares! – courtesy stellarium
Saturn and Mars are in the Morning sky West of the Sun (preceding the sunrise) as shown below:
-courtesy Sky and Telescope Magazine – April 2016
April 15 2016 – Quick Observing Report
We had 3 telescopes
- Stargazer Steve 6″ F8 Dobsonian Reflector
- Stargazer Steve 8″ F6 Ultimate (portable) Reflector
- 130mm F5 (650mm Focal Length) AWB Heritage 130 Dobsonian
We aligned on the bright object – Planet Jupiter and observed the moons Io, Europa – showing transit (and shadow)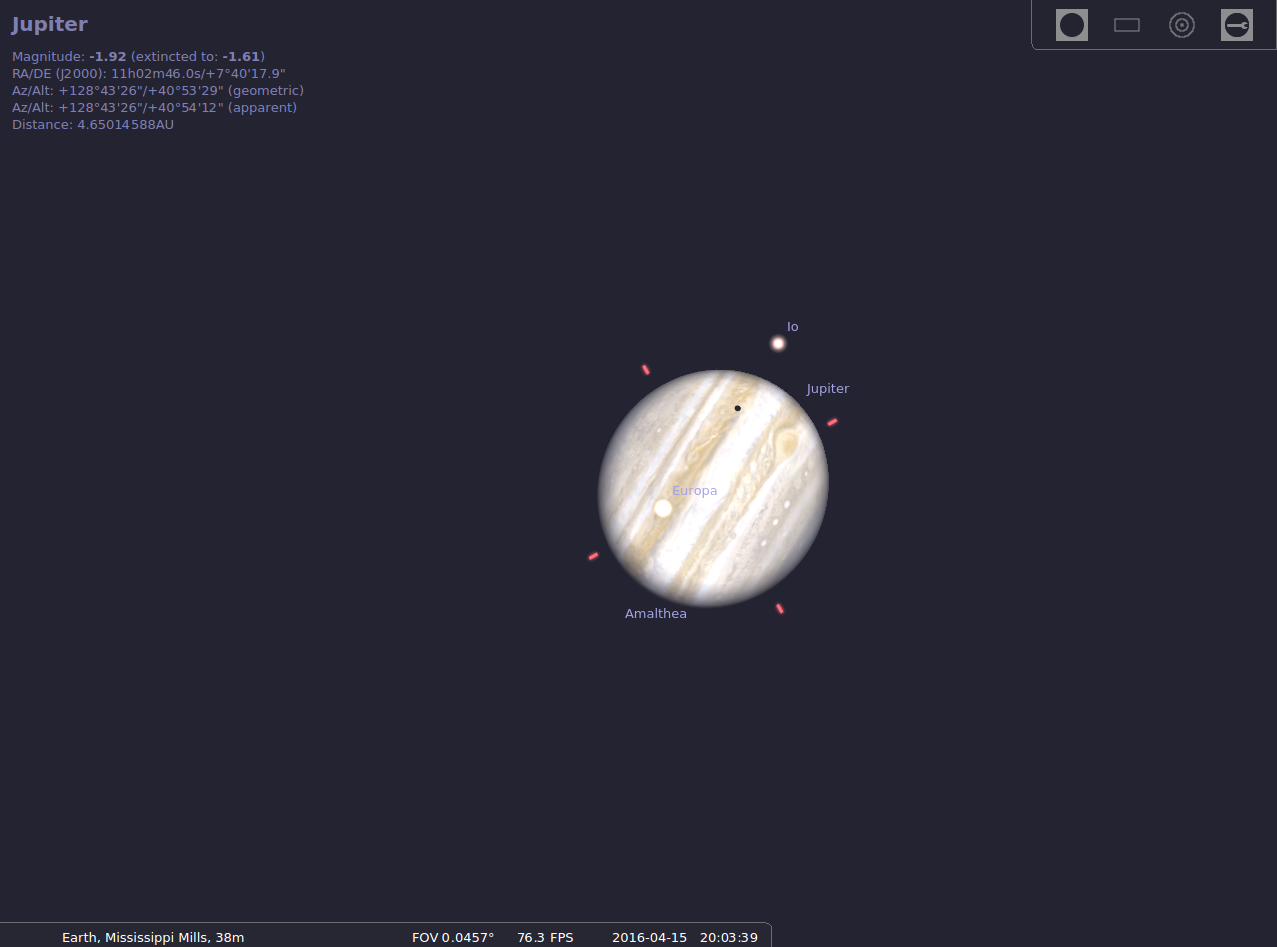
– Jovian Moons April 152016 after 8pm stellarium
Transits of Mercury – May 9 2016. Use Stellarium to simulate the event
Transit of Mercury – planet transit across the disk of the sun… May 9 starting 7am EDT Eastern (EDT) 7:12 a.m. 10:57 a.m. 2:42 p.m.
See Sky and Telescope May 2016
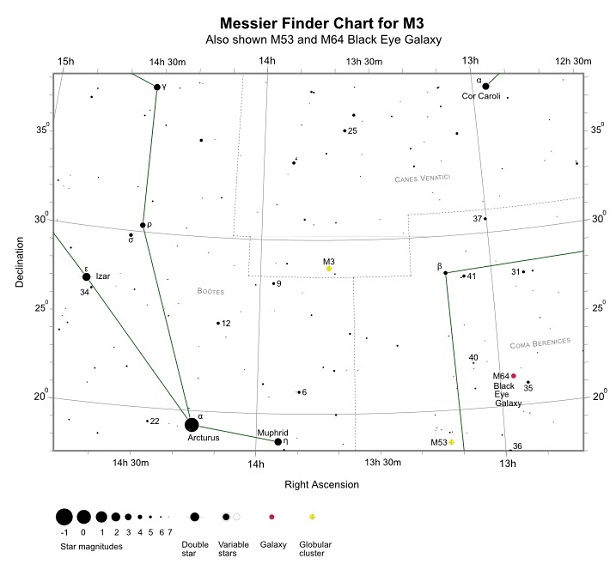
- Next moved to Southern Sky, identified bright star Arcturus (“follow the arc (of the Big Dipper) to Arcturus”) and searched for Globular Cluster M3 – A CHALLENGE with forst quarter moon. So how did we find it…
- Note that M3 is really 40% of the way from Arcturus to Cor Coroli (the bright star alpha CVn) Finder char courtesy http://freestarcharts.com/ search for Messier M3
See Early Spring Observing – Millstone News Night Sky”
April 22 2016 – What to observe when the Moon if Full?
When the moon is full, even the features on the moon are washed out. Shadows disappear, and everything is flooded with moonlight.
Fortunately the quality of moonlight is still conserved in Mississippi Mills thanks to the Preservation of our Night Skies. But what about folks who do not live in an area with this kind of protection. The result is the constant exposure to artificial light…
Here is a report: Consequences to Lighting up the Night
(Report from RASC related activities – Winnipeg: http://www.winnipegfreepress.com/local/artificial-lights-do-worse-than-just-ruin-the-view-125284718.html)
In Mississippi Mills, Moonlight (rather than Artificial Light ) does make it a challenge to observe deep sky objects or even the yearly April Lyrid Meteor Shower (see 2016 – moony Lyrids .. )
Observations at Full moon – suggestions:
- Observe and learn the constellations
- Observe the brightest stars and learn their names and starlore
- Study their starlight by observing:
- colour
- estimating relative brightness
- studying spectra using a spectroscope
Prisms – Sunlight – Seeing the different wavelengths of light
Rainbows of colour can be seen passing through water droplets or transparent media – see Rainbows and Rain – Millstone News article – October 2014
Here is an equilateral acrylic prism. If we set this up in front of a light source like our star, the Sun, (and even better if we arrange the light to squeeze through a slit…)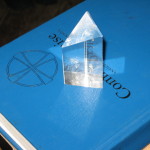
Here’s what we get:
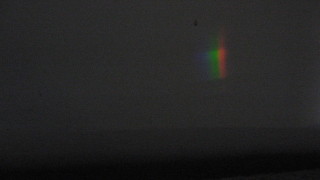
Notice that the slit produces a well defined separation of colours, and the pinhole produces a more blurry image. Isaac Newton, the first to discover that light intrinsically contains all the wavelengths in the rainbow of colours, used a pinhole ‘camera’ to view the light streaming through the prism. However Newton produces a series of different colored images of his pinhole – each one overlapping the next, not a very clear image. With a narrow slit (discovered by Wollason) there is only a small amount of overlapping of neighbouring images of the slit, and we see a clear, well-defined spectrum. Later, Fraunhofer perfected the slit method and discovered vertical dark absorption lines when observing the solar spectrum.
What’s going on?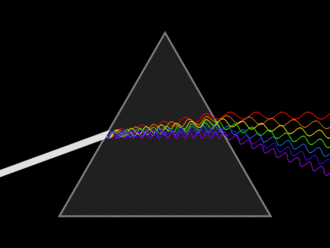
- Visible light, represented here by a white beam, is actually made out of light of several frequencies (colors) travelling together.
- These basic frequencies of visible light are part of what we call visible spectrum, and it is only tiny part of the entire spectrum.
- As light enters a the acrylic prism , each of its composing wavelengths will travel at a different speed in the new medium, and this change in speed is what bends the path in which light is travelling.
- This is the phenomenon we call refraction.
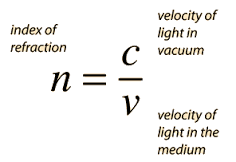
- The ratio between the speed of light in vacuum and the speed of light in a medium is what we call index of refraction, and this value is specific for a given wavelength and medium.
- Since light of different wavelengths will change direction by a different amount, we see the difference wavelengths of light, represented here by colored waves. This is what we call dispersion of wavelengths.
- In this animation, we can easily see the difference on their speeds.
-
- Red, with a long wavelength, passes through almost without any change, whereas blue (with short wavelength) is left behind by all the other colors.
- However, this difference in speed does not persist once the light exits the prism back into the air, and this can be seen on how all light exiting the prism will once again travel at the constant speed of light
Information – courtesy http://commons.wikimedia.org/wiki/File:Light_dispersion_conceptual_waves.gif
Diffraction gratings – how they work
When a beam of light is directed at a diffraction grating along its axis, a sef of coloured spectra are observed on both sides of the central white light as shown. The central white light will represent the un-diffracted image of the star. The different bands of colour are the result of wavefront bending as they get squeezed through the narrow apertures. As the waveforms exit, they interfere with each other.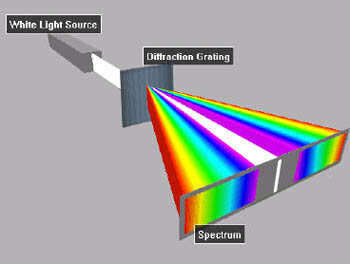 For a diffraction grating, as with a prism:
- red light which has the longest wavelength is diffracted through the largest angle
- Violet light has the shortest wavelength and is diffracted the least.
Thus, white light is split into its component colours from violet to red light. The spectrum is repeated in the different orders of diffraction. Only the zeroth order spectrum is pure white. -information courtesy: http://h2physics.org/?cat=49
– courtesy Ken Harrison, Astronomical Specctroscopy for Amateurs
“No laboratory jar on Earth holds a sample labelled ‘star stuff’ and no instrument has probed inside a star. The stars are beyond our reach, and only information we can obtain about them comes to us hidden in light” – Michael A. Seeds , Horizons – Exploring the Universe
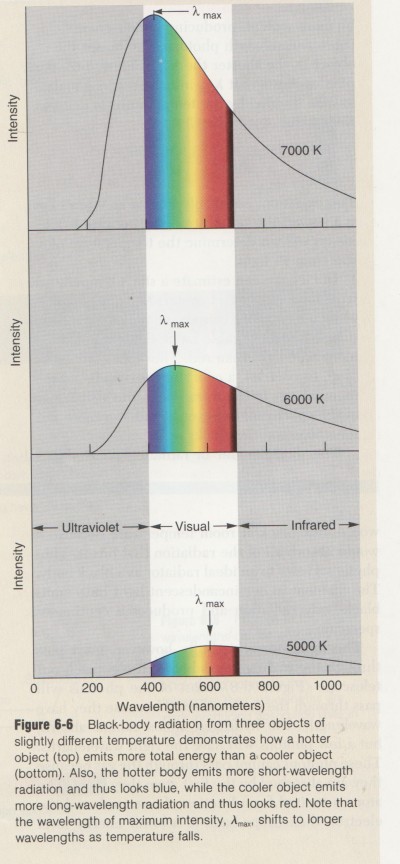
Star Colours Determine Star Temperature
Stars show different colours because their of their temperature; some are hotter than others. Deep in their interior all stars are enormously hot (measured in millions of degrees), but their temperature lessens towards their outer layers, and the coolest star pours out most of their visible radiation in the red part of the spectrum. Hotter stars like the Sun appear yellow, still hotter stars appear white, and the hottest appear blue. Stars radiate light a little like glowing coals in a campfire. Just as a glowing red-hot coal is cooler than a white-hot coal, for example, so a red star is cooler than a white star, and a white star is cooler than a blue star.
Star Color and Temperatures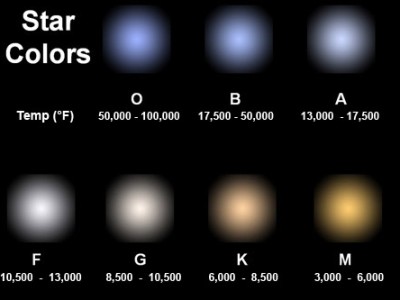
Heat is kinetic energy at the level of atoms. The vibrating atoms collide with the electrons in the material, and each time the motion of the electrons gets disturbed in at a particular quantum level, a photon is emitted. Heated objects emit electromagnetic radiation. The hotter the object, the more radiation it emits. The energy is most intense at a specific peak wavelength .
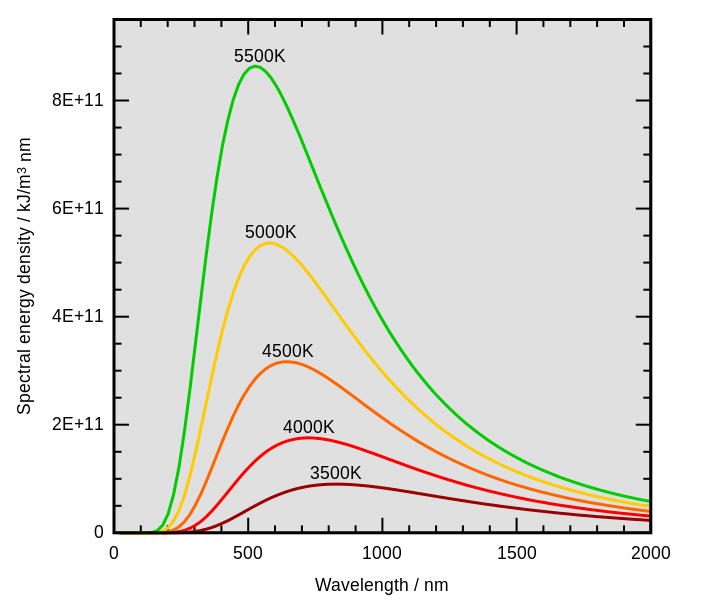
Stars have color variations which we can perceive even without optical aids, and this is related to the characteristic wavelength recorded in the stars.
From the graph, we can see that the hotter the object, the shorter the peak wavelength. We know the relationship as Wien’s Law:
![]()

 – courtesy By 4C – Own work based on JPG version Curva Planck TT.jpg, CC BY-SA 3.0, https://commons.wikimedia.org/w/index.php?curid=1017820
Peak radiation for Shorter(bluer) Wavelength = high temperature ~ Blue Stars
Peak radiation for Longer (redder) Wavelength = low temperature ~ Redstars
This physical law gives us the key to estimate a star’s temperature from the starlight. Knowing the temperature (thousands of degrees), we can apply our models of the energetic nature of stars and their physical processes to graph them and classify them.
Star Color and Spectra
But that’s not all – When we use a grating on our telescope, we find that stars show spectra with dark and bright lines mixed in at special intervals …
Why are Stellar Spectra Important?
To those who can read its meaning, the spectral code tells at a glance just what kind of object the star really is: its color, size, and luminosity compared to the Sun and stars of all other types; its peculiarities, its history, and its future. …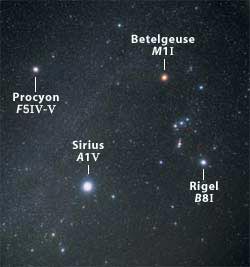
See : Sky and Telescope – The spectral types of stars
- A special treat: Study their starlight by observing spectra using a spectroscope
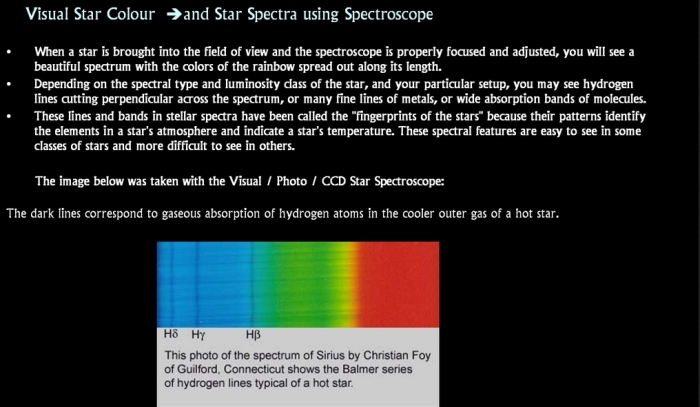
- A spectroscope is a device we put on the telescope that splits the starlight into spectral components and reveals the special signature of dark (or bright lines) at various places along the ‘rainbow’ of wavelengths.
Rainbow Optics Spectroscope – What you will see!
Starlight – The Signature of Stars “hidden in light”
Starlight Analysis in terms of Spectra
When we record starlight passing through a prism and diffraction grating (a spectroscope) unto special cameras, we split the components of light into a rainbow of colors interspersed with spectral lines. The position of the lines is compared to a standard ‘plate’.
Each dark line that appears in a certain colour band (frequency) represents the detection of the gaseous state of a chemical element. when plotted as a light curve the dark lines reveal reduced intensity (dips) how much hydrogen or helium gas is absorbing light radiation.
Each line indicates ion of a certain chemical chemical element with the line strength indicating the abundance of chemical components such as hydrogen and helium in a gaseous ionic form (with electrons removed from the atom).

In this illustration the
- light from the source must pass through the hydrogen gas (representing a stellar atmosphere) before it can reach the telescope.
- These photons pass through the gas because they are absorbed by the first photon they meet.
- The atom is excited, goes into higher energy level, and then drops down to a lower energy level when a new photon is emitted
- The original photon was travelling towards us, but the re-emitted photon goes off in some random direction, “scattered” – so the result is a black line in the spectrum at that location.
- These dark lines are called absorption lines because the atoms absorb the photons
- These are the same lines that Fraunhofer saw in the solar spectrum
- Because only photons of certain wavelengths can only be absorbed or emitted in packets (quanta) of energy (quanta state in the electron orbits), each kind of atom has its own set of spectral lines
- Hence we can see not only hydrogen absorption lines, but sodium, calcium and other chemicals indicating the chemical composition of the stellar atmosphere
Forum for Amateur AstroSpectroscopy
Characteristic Lines by Spectral Class
Below is a basic list containing a few elemental lines in stellar spectra. Some of the prominent, or characteristic, lines are shown that might be used to broadly identify the types. Observing all of them will depend upon equipment, the seeing conditions as well as your eye acuteness. Wavelengths given are in Angstroms.
- Type O: Hottest blue stars (>55,000 °K to 30,000 °K). Ionized Helium (4541 and 4687) predominates. Occasionally the Hydrogen Balmer lines are seen weakly (see Balmer Series below under Type A) as well as very weak neutral Helium (3888, 4472 and 5877). Other very faint ionized Oxygen, Nitrogen, Silicon and Carbon lines may be present.
- Type B: Hot blue stars (30,000 °K to 10,000 °K) .Neutral Helium (3888, 4121, 4472 and 5877) lines dominate and max at B2. Hydrogen Balmer lines become progressively stronger through this type. Other very faint ionized Magnesium, Silicon and Carbon lines may be present.
- Type A: Blue stars (10,000 °K to 7,400 °K). Hydrogen Balmer lines dominate and max at A0. The H and K lines of ionized Calcium (3968, and 3934) become strong as neutral metals may appear weak. The Hydrogen Balmer lines: Ha – 6563; Hb – 4861; Hg – 4340; Hd – 4102; He – 3770.
- Type F: White stars (7,400 °K to 6,100 °K). Hydrogen lines are weakening. H and K lines of ionized Calcium strengthen as well as many fine lines due to other metals.
- Type G: Yellow stars (6,100 °K to 5,300 °K). Many fine lines appear due to many neutral metal elements such as Iron, Manganese and Calcium. The broad molecular CH G-band (4314) appear.
- Type K: Orange-red stars (5,300 °K to 3,800 °K). Hydrogen lines are gone. Broad TiO bands (4661, and 4955) begin to appear. The ionized Calcium lines are strong. CH band is very strong.
- Type M: Red stars (3,800 °K to 2,200 °K). Broad TiO bands (4661, and 4955) dominate the spectrum. Neutral metal lines throughout the spectrum.
Good for learning
- Location of the Brightest stars
- Constellations
- Colour and Spectra
(if we use our Rainbow Optics Diffraction Grating)
To learn how variations in starlight provide fundamental measurements of
- distances to the stars
- mass. stellar atmosphere, radial velocity of the stars
- evolutionary state of the star
See Stars and Starlight in our Milky Way: Stars and Starlight in our Galaxy