
by Pat Browne
Spring Astronomy Course Mississippi Valley NightSky Conservation
IV The Art and Science of Observing the NightSky Around Us

Program developed by:
Mississippi Valley Conservation Authority
Royal Astronomical Society of Canada
Ottawa Astronomy Friends
Instructors:
Pat Browne
Rick Scholes
Guest Astro-Photographer and Astro-Artist: Sanjeev Sivarulrasa
Field Trip Tonight: Moonlight Walk and Astro-Tour at the Fred Lossing Observatory (if clear; otherwise next week...)
Earth Centered Universe software fori llustrations: courtesy David Lane
WHAT
Can we glean from Starlight?
-
Color (representing peak
wavelength)
-
Spectral lines in the Color Bands
-
Periodic Brightening and Dimming
of Special Stars (Variables)
Do stellar classifications tell us?
-
Mass
-
Temperature
-
Chemical Composition
-
Stage of life
WHERE
How far are the stars and star
clusters?
-
The Calibrated Distance ladder
WHEN
- Stellar Evolution: Stages of development in Stellar History
- Spectral classifications tell stories of Red Giants, WhiteDwarfs, and supernovae as different stars pursue their uniqueevolutionary path
WHO
- Henrietta Leavitt – researcher stellar period-luminosity relationship
- Sanjeev Sivalrurasa (our featured guest artist) – artisticrelationships
- Books
- Red Giants and White Dwarfs, RobertJastrow
- Stars and Their Spectra, James B. Kaler
- Art and Science Journal
- Celestial Sampler, Sue French
Three things that unify our understanding of the art and science of astronomy are the three things we can observe:
- Starlight and Stardust (in the eyepiece or image recording device)
- Stellar Color and Spectra
- Stellar Magnitude and Brightness or brightening/fading over time This lecture highlights these observations and how we interpret the data, first from an artistic viewpoint, and then from thescientific analysis.
1- Starlight and Stardust
Observing the starlight through special filters and spectroscopic
gratings brings many hidden features to life. Many stars and star
clusters reveal a certain nebulosity, a faint glow of varying
brightness extending from the point source. This glow or nebulosity
illustrates:
- dust and gas around the star either due to stellarwinds…could be highly ionized molecules (doubly ionized oxygenfor example)
- stellar formation – the interstellar media iscoalescing into proto-stars
- stellar explosion or out-gassing from an exploding ,oscillating dying star
Starlight can be filtered to further study this phenomena:
- Eyepiece filters for telescopes, can optically improve thedefinition of nebulousity if it can be seen around stars
- Scientific filters, can get the light intensity at certainwavelengths and use this data to classify the Stars according toOBAFGKM stellar types .
These filters are normally in the Blue (B) and V for transparent
or (V)isual or transparent
- Using special gratings, we can observe very special emissionor absorption lines which tell us about the (gaseous) chemicalcomposition of the star:


Using electronic imaging devices, color and value changes in the starlight can be explored, composed, subjectively interpreted. In The Art of Observing”, Sanjeev will talk about an artist’s perspective on the night sky. His celestial portraits describe the artistic process…
 Image- Courtesy Sanjeev Sivalrurasa

Special filters and spectrographs reveal the electron transitions that must be happening in the outer envelope of a dying star. The above is a sketch of this nebula.
I – Star Color and Spectra: Classifying Stars –
Optically (wavelengths) and Spectroscopically (lines)
Stars may look like simple points of light to our eyes, but in reality, like our Sun, they are vast nuclear furnaces that are capable of converting matter into energy, as a by-product illuminating our earth or sky, making it possible to exist and in turn appreciate their beauty. (Kaler Stars and Their Spectra, p,3)
A normal star is a huge ball of gas compressed by its own gravity. The gas is dense enough to keep an energy producing nucleosynthesis alive in its core. This nucleosynthesis works at a temperature above 10 million Kelvin in the interior of the star. It produces a pressure pointing outside against the direction of gravity. And it makes the star shine.
Using special filters and spectroscope, we can examine the nature of the wavelengths
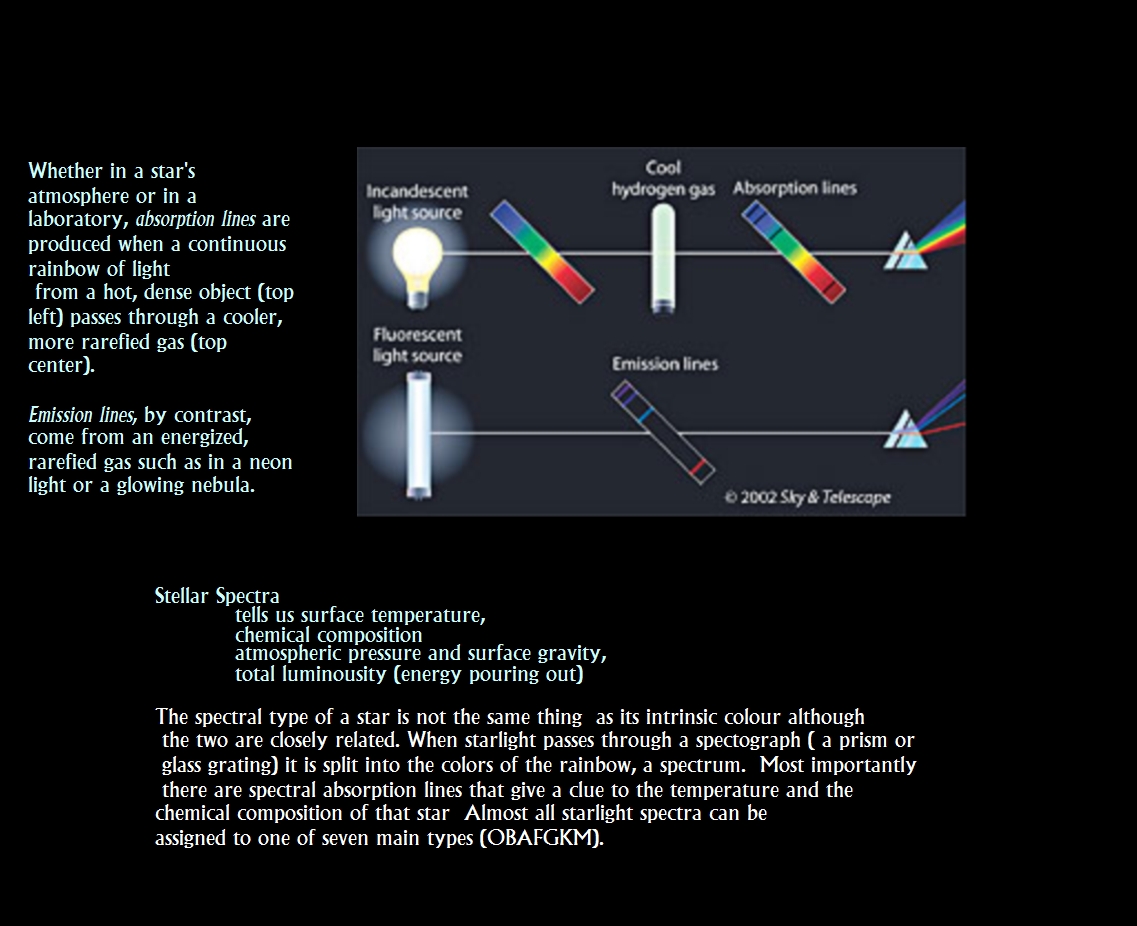
The stellar spectra consist of two components.
- The continuum
- absorption lines, and sometimes there arelines in emission. The major source of lightis the continuum
Hot and very dense gases emit a continuous
spectrum. Here we can assign a number to every color in our
spectrum. This is light from an incandescent (burning) source

A gas can emit light if it is hot enough or it is excited in an other
way. The spectrum is not a continuum but consists of a typical set
of wavelengths. Each chemical element has its own set of emission lines.

If we look through a cool gas which envelops a hotter gas, we can see
the spectral lines corresponding to the elements in the gaseous
layer in absorption. The gas is cooler than the hot gas obscured by
it,and so these wavelengths are shown as opaque dark lines.

The peak wavelength of the star which corresponds to a particular
color index, as well as the emission or absorption
lines that the spectra contains uniquely determine the
stellar spectral class.
Stellar Spectra indicate ENORMOUS Temperatures due to Thermonuclear Reactions

Calculations of solar thermonuclear energy available for hydrogen-helium
conversion (and hence number of years of burning) courtesy Zelik and
Smith, Introductory Astronomy and Astrophysics, Section 16-8
It was shown that it is the thermonuclear reactions which accounts for the energy source for 10 billion years of sunshine (p. 274)
Stellar Evolution and Stellar Masses
Although the stars appear to be unchanging, they are actually undergoing steady alterations as their fuel supply us used up . We are fooled because human existences is so short compared with the time over which stars live: 10 Billion years for the Sun. However the Sun is in a particularly stable stage of its life, being a member of what astronomers call the ‘Main Sequence’. The fusion of hydrogen to helium is the first and by far the longest stage in the history of the star. (Stars stay on the Main Sequence curve for 99 % of their lifetime) . The most important physical quantity for a star is its mass, which determines the entire evolutionary path over which it will wander during its life, as well as the age it will reach before it dies.
The final evolution of a star is mainly dependent upon its initial mass, and we classify stars relative to the mass we know best: the Solar Mass. All stars lead similar lives (while on the Main Sequence) to the time of their demise. Their manner of dying depends on their size. The small stars shrivel up, while the large ones disappear in a gigantic explosion. The sun is expected to end up as a ‘planetary nebula’ at the end of its life (i.e. like M57, the Ring Nebula) and eventually fade away.

courtesy: nrumiano.free.fr/Estars/fading.html
The Hertzprung-Russell Diagram for Classifying Stars
Once the spectral class is known, the Hertsprung-Russell diagram is used to place the star at a point corresponding to the type of star it represents. That type of star falls into one of five luminosity classes which is largely based on their masses with respect to 1 solar mass. Here, the HR-Diagram is shown with respect to Mass.

Luminosity Class
(courtesy http://www.spektros.de/lumi.html)
The masses of the stars lie in the range from a quarter of a solar mass up to 20 solar masses. A physically
large star is usually brighter and will have narrower spectral lines than a smaller star. So we have another component of the
spectral classification, the Luminosity Class.
The luminosity class is added in Roman numerals after the temperature spectral class.
| Supergiants | |
| II | Bright Giants |
| III | Giants |
| IV | Subgiants |
| V | Dwarfs (=Main Sequence Stars) |
| VI | Subdwarfs |
| VII | White Dwarfs |
Our sun is a normal main sequence star an is classified as G2V. Recall a favourite bright star with color: (hint follow the arc to Arcturus…)
Arcturus:
A type K1.5III orange giant star, with an absolute magnitude of −0.30. It has likely exhausted its hydrogen and
has begun fusing helium into oxygen and carbon in its core. It will continue to expand before sloughing off its outer shell and ending
its life as a white dwarf inside a planetary nebula.Every class is subdivided in decimal subclasses like B9, A4,
K3. Not all decimal subdivisions are used in every major class. We won’t discuss this here in detail. If we can determine the subclass
from our spectra this is explained. The Sun for example with a surface temperature of 5700 K is classified as G2 star.

See: http://www.astronomynotes.com/starprop/s5.htm
Absolute Magnitude of a Star

By comparing this intrinsic brightness to how bright it appears to be, one can determine the star’s distance if and only if the star is on the Main Sequence
Astronomers speak of a distance ladder. Each run gives a ‘leg-up’ to the next method of distance determination. The first method of measurement is direct; the rest use indirect methods calibrated using a ‘standard candle’, something that you know is a certain absolute luminosity (magnitude) and hence determine its distance by measuring its absolute magnitude and comparing it to its apparent magnitude
Direct Measurement to Nearby Stars using
Stellar Parallax (done by Satellite Hipparcos now)

The KEY to going from Direct Measurements such as trigonometric parallax for nearby stars, to indirect measurements, is we calibrate the indirect measure of Absolute Magnitude using
parallax. We can calibrate the relative magnitude observed (even visually) to the Absolute magnitude derived scientifically and get the true brightness and distance modulus for that star.
Recall our visual magnitude scale:

Distance Modulus
We use the known absolute magnitude of a well-known star cluster to determine that of the unknown cluster. Astronomers take images of the cluster through special Blue and Visual filters to determine the apparent magnitudes very accurately. The difference between the Apparent and the Absolute magnitudes gives the distance to the cluster. This formula is for measurements in parsecs:
- m – M = 5.5
- m – M = 5 * log(d) – 5
- Therefore D = antilog((m – M + 5)/5)
- D = 10^2.1 = 126 pc


III Stellar Magnitude and Periodic Brightness Observations
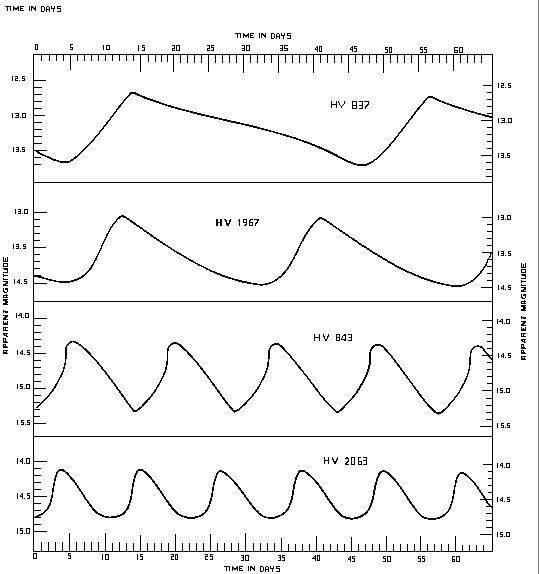
Variable Stars – Periodic Variations in their brightness lead to a calibration of values of Absolute Magnitude which help to determine true stellar distances.

Variable Stars – Henrietta Leavitt: Period-Luminosity Relationship
VariableStars – Henrietta Leavitt: Period-Luminosity Relationship . Watch how Henrietta discovered using Cepheid Variables the true, absolute brightness of these special ‘standard candles’; thereby calibrating the Main Sequence:
Link to the video: Henrietta Leavitt
For Cepheid Variables , Henrietta determined the Period-Luminosity Relationship which calibrates the Absolute Magnitude Scale:

courtesy http://dept.math.lsa.umich.edu/mmss/coursesONLINE/Astro/Ex1.4/
Re-Searching the Stars…
We have seen…observations and recording techniques
- I Star Gas and Dust (nebulosity)
- II Star Light Colour(peakwavelength) Spectral lines (Classes OBAFGKM)
- III Star Brightness – Variable Period
…Lead to
- Stellar Classification, (temperature), stellaratmosphere, gaseous chemical composition
- Absolute Magnitudes which leads to distances in lightyears
- Mass determination relative to our Solar Mass
- thermonuclear processes and stellar evolution

The moon is full tonight …

Therefore the best objects to observe are bright stars. Lets see if we can celebrate the science and art to be found in
stellar hues.

Observing Plan courtesy Sue French, Celestial Sampler
Observing Plan Notes:
List of Double Stars and Stars with Spectral Hues
- Cor Coroli – Alpha Cvn
- Mu Cephei – Garnet Star
- Delta Cephei – Famous Variable Star
- Colorful Doubles in Bootes
- Mu,Epsilon, Pi, Xi
- Arcturus – Bright Star in Bootes (Follow the arc…)
- Mizar – Ursa Major
- Epsilon Lyrae – the ‘double double’